Create a Supervisor/Team Slicer for the Org Chart Visual
You can filter your Org Chart by team or supervisor by creating a separate Supervisor/Team table and using it as a slicer. Follow the steps below to set this up in your own Power BI report.
Step 1 — Create the Supervisor/Team Table
Use the example report provided: TeamFilter.pbix. It contains a Power Query script that automatically generates a Supervisor/Team table from your data.
- Open the example report.
- Go to Transform Data → Power Query Editor.
- Open Advanced Editor.
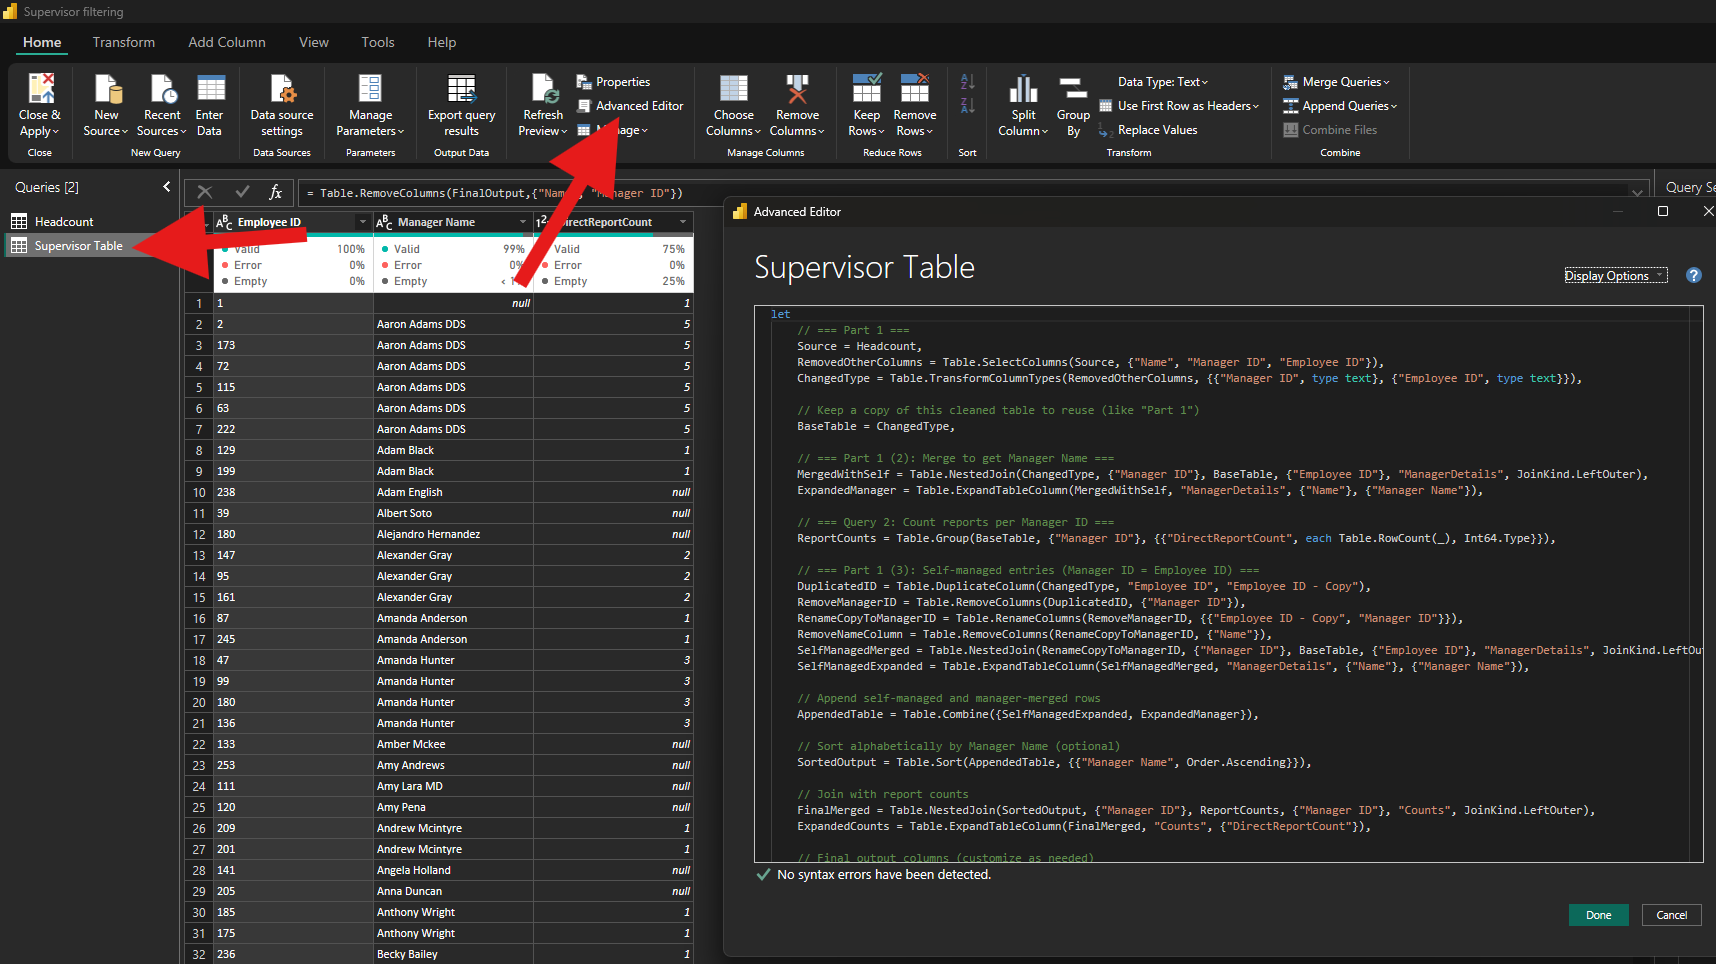
- Copy the full Power Query code shown.
Step 2 — Add the Code to Your Report
- Open your own Power BI report.
- Go to Transform Data → Power Query Editor.
- Create a New Query → Blank Query.
- Open Advanced Editor, paste the code, and update the column names to match your dataset.
- Click Close & Apply.
Supervisor/Team Table – Power Query (M Code)
let
    // === Part 1 ===
    Source = Headcount,
    RemovedOtherColumns = Table.SelectColumns(Source, {"Name", "Manager ID", "Employee ID"}),
    ChangedType = Table.TransformColumnTypes(RemovedOtherColumns, {{"Manager ID", type text}, {"Employee ID", type text}}),

    // Keep a copy of this cleaned table to reuse (like "Part 1")
    BaseTable = ChangedType,

    // === Part 1 (2): Merge to get Manager Name ===
    MergedWithSelf = Table.NestedJoin(ChangedType, {"Manager ID"}, BaseTable, {"Employee ID"}, "ManagerDetails", JoinKind.LeftOuter),
    ExpandedManager = Table.ExpandTableColumn(MergedWithSelf, "ManagerDetails", {"Name"}, {"Manager Name"}),

    // === Query 2: Count reports per Manager ID ===
    ReportCounts = Table.Group(BaseTable, {"Manager ID"}, {{"DirectReportCount", each Table.RowCount(_), Int64.Type}}),

    // === Part 1 (3): Self-managed entries (Manager ID = Employee ID) ===
    DuplicatedID = Table.DuplicateColumn(ChangedType, "Employee ID", "Employee ID - Copy"),
    RemoveManagerID = Table.RemoveColumns(DuplicatedID, {"Manager ID"}),
    RenameCopyToManagerID = Table.RenameColumns(RemoveManagerID, {{"Employee ID - Copy", "Manager ID"}}),
    RemoveNameColumn = Table.RemoveColumns(RenameCopyToManagerID, {"Name"}),

    SelfManagedMerged = Table.NestedJoin(RenameCopyToManagerID, {"Manager ID"}, BaseTable, {"Employee ID"}, "ManagerDetails", JoinKind.LeftOuter),
    SelfManagedExpanded = Table.ExpandTableColumn(SelfManagedMerged, "ManagerDetails", {"Name"}, {"Manager Name"}),

    // Append self-managed and manager-merged rows
    AppendedTable = Table.Combine({SelfManagedExpanded, ExpandedManager}),

    // Sort alphabetically by Manager Name (optional)
    SortedOutput = Table.Sort(AppendedTable, {{"Manager Name", Order.Ascending}}),

    // Join with report counts
    FinalMerged = Table.NestedJoin(SortedOutput, {"Manager ID"}, ReportCounts, {"Manager ID"}, "Counts", JoinKind.LeftOuter),
    ExpandedCounts = Table.ExpandTableColumn(FinalMerged, "Counts", {"DirectReportCount"}),

    // Final output columns (customize as needed)
    FinalOutput = ExpandedCounts,
    #"Removed Columns" = Table.RemoveColumns(FinalOutput,{"Name", "Manager ID"})
in
    #"Removed Columns"
Step 3 — Create the Relationship
Connect the new Supervisor/Team table to your main dataset.
- Go to Model View.
- Drag the Team or Supervisor column from the new table onto the matching ID column in your main table.

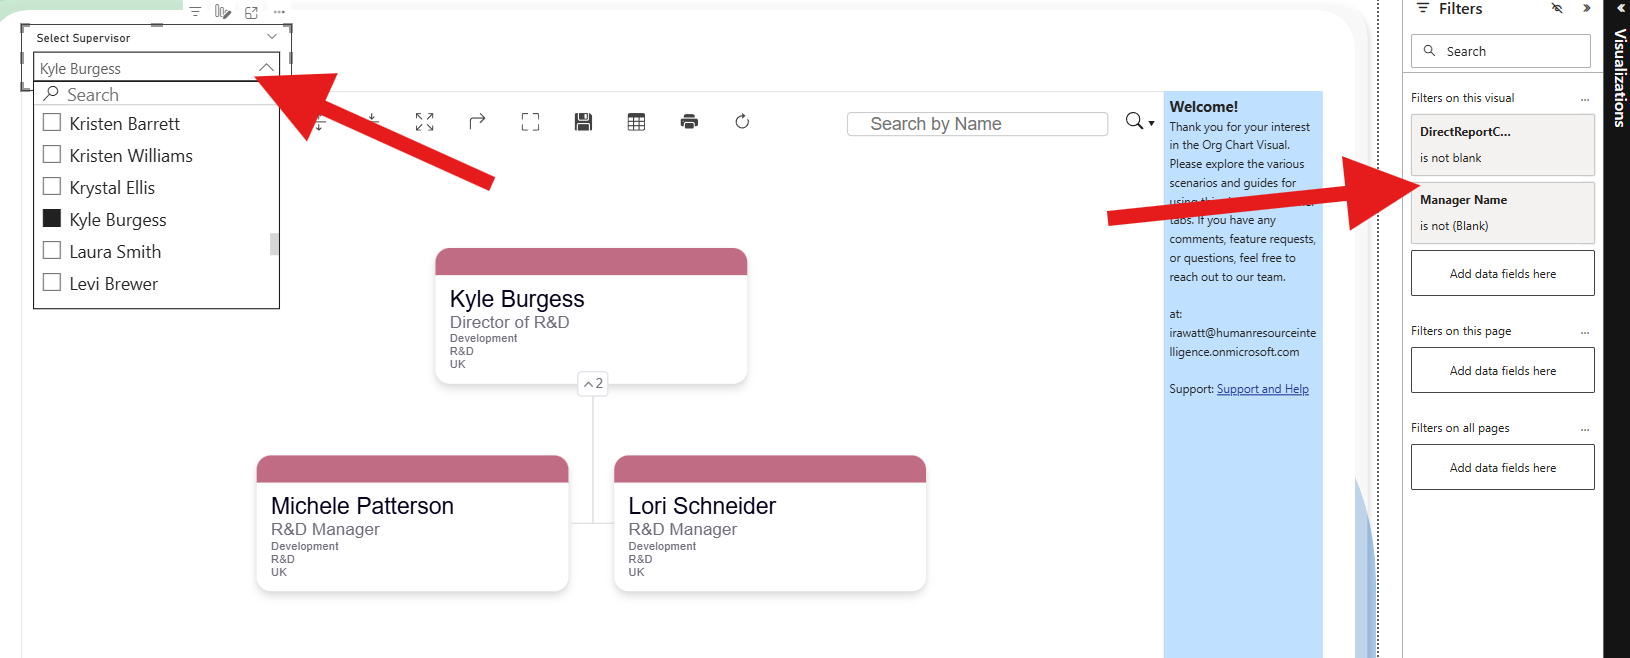
Step 4 — Add the Slicer
- Insert a Slicer visual onto your report page.
- Add the Team or Supervisor field from the new table into the slicer.