Workforce planning in Power Apps
The next step after the org chart visual
If you already use Org Chart Drag & Drop, you can design structure inside Power BI: move a reporting line, save a scenario, and export the change. Workforce planning usually needs one more step. HR business partners, finance partners, and the people team have to work on the same options early, while the plan is still open.
A Power App is a practical way to do that. It is a bespoke application for your own organisation, kept inside Microsoft 365, and connected to Dataverse or the internal systems that already hold your workforce data. Partners see the same scenarios, the same assumptions, and the same edits. The conversation starts while the options are still being formed, which is when it can still change the decision.
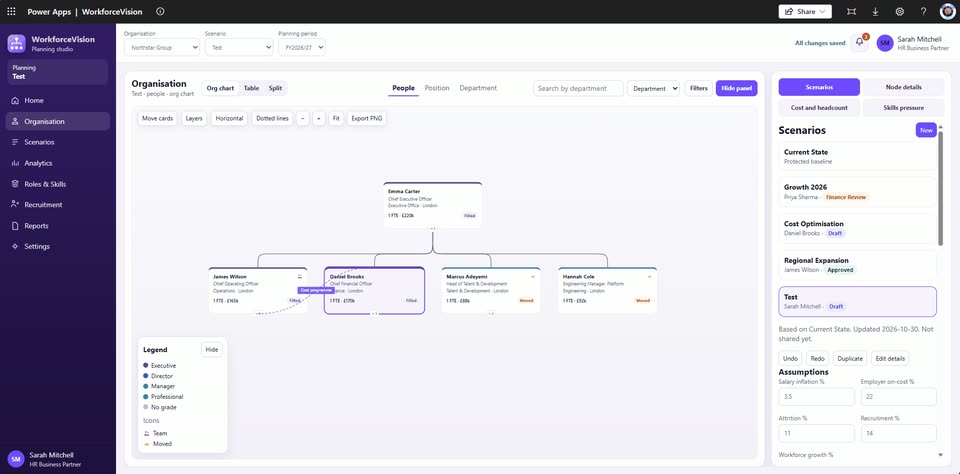
Planning studio is an application we built for that cycle. The screen above uses a sample organisation, Northstar Group. It shows the kind of org design and workforce planning app we build for teams who already use the org chart visual.
Organisation
The organisation page is where the structure is edited. You can work on an org chart, in a table that behaves like Excel, or in a split view with the chart and the table side by side. Move cards, set the layers, and keep dotted-line relationships on the chart. When a steering pack needs the picture, export the chart as an image.
The same page shows what the edit does to the organisation. KPI views such as cost and headcount, and skills pressure, update with the scenario, so a move is visible as a change in the numbers and in the shape of the structure.
Several scenarios can be open at once. In the sample that includes a protected current state, a growth case, a cost case, and a regional case, each with an owner and a status. Duplicate a scenario, step backwards, and leave the baseline as it was.
What-if analysis
The what-if station is where a scenario is tested as a decision. Planning assumptions travel with the case: salary inflation, employer on-cost, attrition, recruitment, and workforce growth. Change an assumption and read the effect on cost, headcount, and the organisation itself.
This is the working session for an HRBP and a finance partner. They review the same scenario, against the same baseline, before anyone treats it as the plan.
Reports
The reports page is how a scenario leaves the app. Export the plan, and export the change log to Excel, so there is a record of what moved, who it affected, and which scenario it belongs to. Governance, audit, and colleagues who still review plans in a workbook can follow that trail. It is the same kind of record the org chart visual already produces inside Power BI, available here from the planning application.
Where this sits next to the visual
Org Chart Drag & Drop remains the way to see and edit structure in Power BI, with your data staying in your tenant. Planning studio is the application around that work: a shared place to run scenarios with HRBPs and finance partners, connected to Dataverse or your internal systems, and shaped around the way your organisation plans.
If you want the same kind of thinking inside a Power BI report, the AI-assisted HR dashboard shows the visual in a full workforce view. An application built around your own data and planning cycle is Power Platform consultancy. We also use Copilot Studio on our own shared inbox, which is described in shared inbox replies.